Capital Equipment Vendors Gain Account Insight

Goal: Integrate Field Focus on Top Accounts, Gain Account Insight, Differentiate on Insight, Grow Share
Medical capital equipment vendors traditionally differentiate themselves on product performance and total cost of ownership. This is an incomplete and unsustainable strategy. Now their largest customers–connected to consolidating provider networks–demand customized vendor service and sales motions. These customers have significant and growing market power (see the Federal Trade Commission’s recent challenges to hospital mergers). Capital equipment vendors must deliver customized coverage to select accounts or their share will suffer. This will require investment in new field coverage models. Done correctly, customized key account coverage will help vendors accumulate deeper account insight, which they can use as a powerful differentiator. But how can vendors accumulate and monetize this insight?
Capital Equipment Medical Devices
Start with field engineering and service. Capital equipment vendors rely heavily on their field engineering and service teams for timely and flawless installation, ongoing maintenance and ultimate customer success. Field engineering and service are critical when (a) the capital equipment is very costly, and (b) it’s used for expensive and/or risky patient procedures. Companies selling the classic big ticket items–radiology and imaging machines–have the most riding on field engineering and service.
Figure 1 below shows the top ten most expensive medical device equipment product categories. Companies selling these products have the most insight to gain from focusing and aligning field engineering, service and sales for key accounts. And the most to lose by doing nothing.
Figure 1–Top 10 Most Expensive Capital Items – July 2016 (Source: ECRI Institute)

Vendors deploy key account management acknowledging their largest customers are enterprises…that happen to have a clinical mission. (See Alexander Group’s (AGI) Chief Sales Digest post, “Evolution in Account Management in Medical Device”). These provider networks behave like corporate enterprises, demanding their vendor sales and service teams comply with their evolving bureaucratic management process. Indeed it’s a challenge to figure out how to deploy key account managers for the customer C-suite. It’s even harder to figure out the clinical sales and service motions on the ground for these customers, at the patient care level, across multiple sites and call points. For the critical few large integrated regional network customers, we recommend capital equipment vendors realign local field engineering, service and clinical sales. A big-ticket capital equipment vendor used this approach to gain (a) greater account focus, and (b) better alignment between service and sales. The following example summarizes one successful approach.
(a) Greater Focus
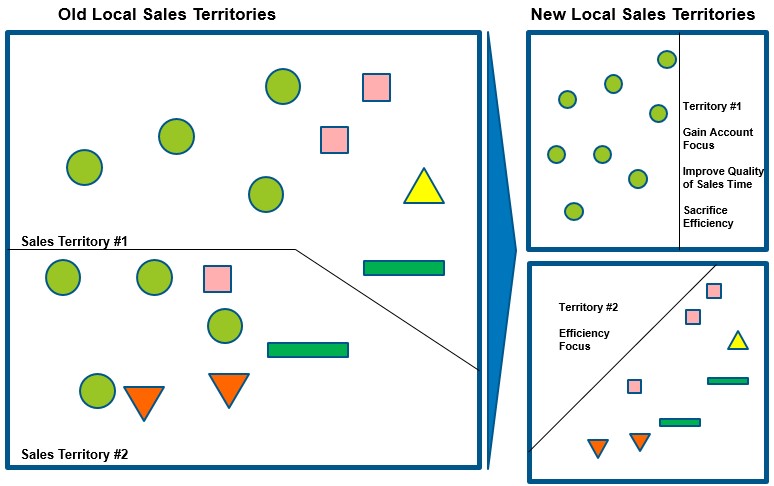
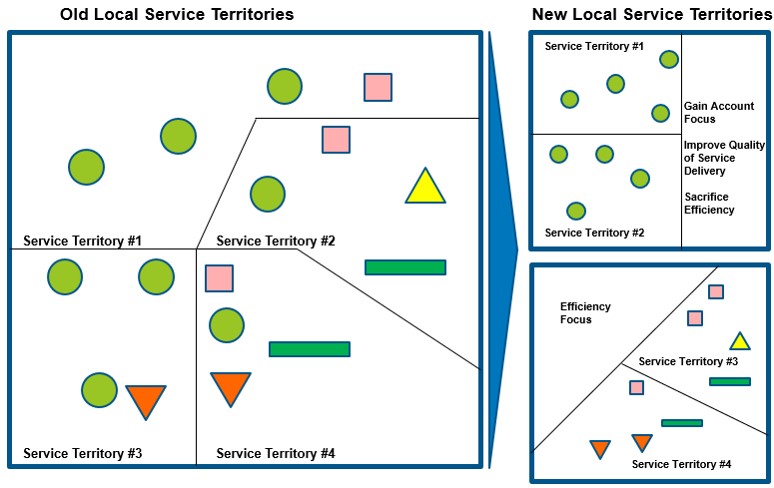
Figures 2 and 3 provide a simplified set of territories for the sales and service organization, with each account designated by a unique color and shape. One account has one site (yellow triangle), the others have multiple sites across the geographic territories. The left side shows the old deployment; the right side shows the new.
The old service deployment emphasized geographic site coverage of the installed base, without an account orientation. The old model assigned four field service representatives and two sales representatives to cover the key account customer sites (green circles). No one in the field focused on the key account sites. What’s more, the key account manager was unable to add much value accumulating dribbles of field insight from six people.
In the new model, the vendor realigned territories to gain maximum account focus from fewer service and sales representatives. Fewer heads deployed but with a greater percentage of their workload focused on the key account. With the focus came account insight. With insight, the quality of the vendor’s service delivered and sales time increased. The new local territories show fully dedicated coverage on the key account from two service reps and one sales rep. But the logic holds equally for non-dedicated account coverage: increase focus on a key account using fewer resources who spend a greater share of their time on the key account. Then realign the non-key accounts on the basis of traditional geographic site coverage efficiency.
Figure 2–Service Territory Realignment
Figure 3–Sales Territory Realignment

(b) Better Alignment Between Service and Sales
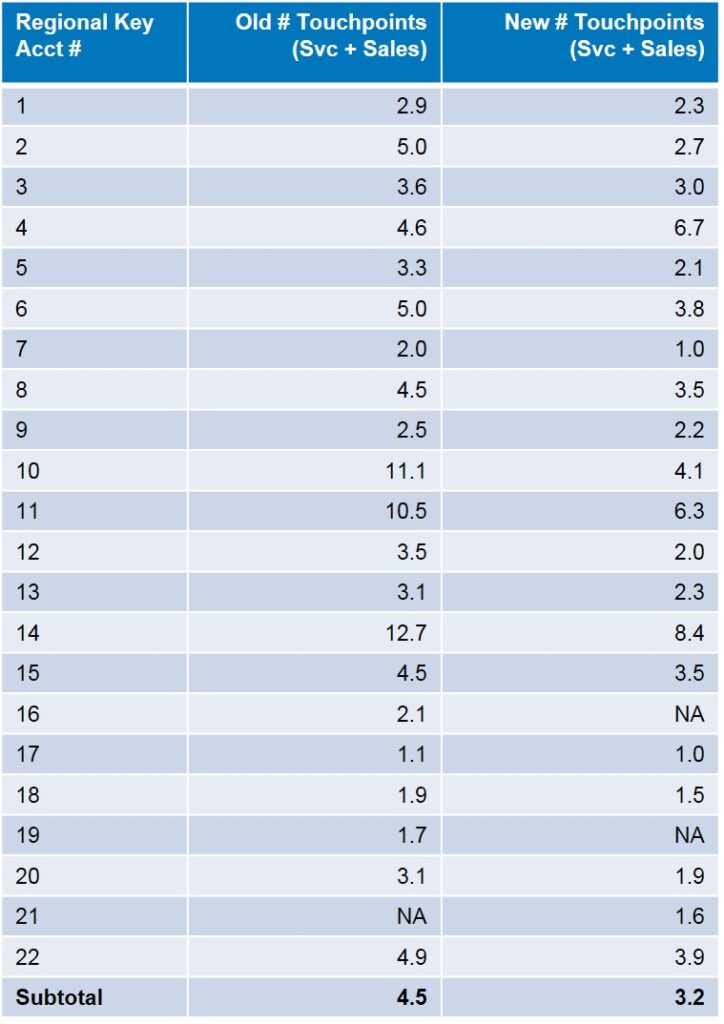
Figure 4 summarizes the impact of the realignment on the number of sales and service representatives (touchpoints) covering the set of regional key accounts. Offloading some non-key accounts, from those sellers covering key account sites, enabled those sales representatives to spend a greater portion of their overall workload on the key account sites. The realignment reduced the number of touchpoints per key account from 4.5 to 3.2 service and sales representatives.
Figure 4–Old vs. New Service and Sales Touchpoints by Account

The old model deployed service and sales resources in silos. Missed opportunities became obvious, where a service representative knew a key piece of information–such as a hospital’s radiology department implementing a process improvement to personalize treatment–but never shared this nugget with the local sales rep. The few observations that were shared between service and sales representatives came by accident, in fragments.
The new model enabled better teamwork and communication, enabling service and sales representatives to implement a consistent approach at the local key account sites. With the “left hand knowing what the right hand was doing,” service representatives executed better-informed and more robust service calls and provided a better customer experience. Teamwork benefits to the sales force appeared quickly. Service representatives provided key information on precise locations and floors for equipment upgrades, service contract expansion and new product launch targeting. Service reps also provided equipment performance data–for the vendor’s and also the competitor’s machines–plus procedure analytics to help the sales reps hone their sales pitch. For management, the alignment enabled integrated service and sales pipeline management.
Conclusion: This local realignment enabled the vendor to gain greater focus on key accounts with fewer service and sales resources deployed to those accounts. In turn, the focus enabled clearer and more frequent communication across service and sales, deeper insight into customer operations, identification of site-level penetration opportunities, non-competitive installations and a 10 percent overall gain in market share in these regional key accounts.
Alexander Group’s (AGI’s) Medical Device consulting practice helps device clients strengthen their position in an increasingly competitive and complex selling environment. Our clients achieve success by delivering insight to customers and adapting winning practices from outside legacy health care sales models. Learn more about Alexander Group’s Medical Device practice.
Read other AGI insights on the medical device industry.
Contact an industry leader.
