How Does Your Portfolio Company’s Sales Force Measure Up?

Part 1 of this series established a go-to-market framework for private equity managers. Part 2 examined the leadership element of this framework: selecting the right leadership to drive top-line growth to the next level. Part 3 addressed the strategy behind the framework. Part 4 addressed structural components of the revenue growth model. Part 5 below examines performance measurement.
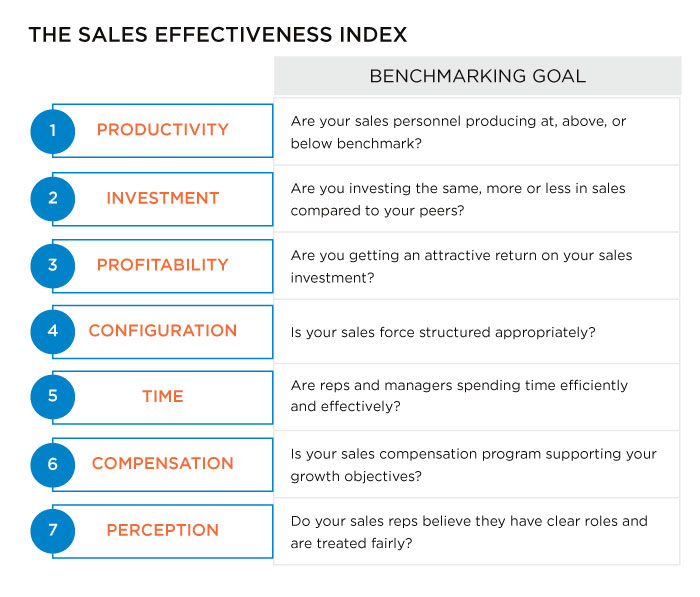
Private Equity (PE) leaders can no longer rely on cost cutting their way to higher exit multiples. They must take into account the health of the sales organization during both pre- and post-acquisition phases. A high performing sales organization can lead the way to growth and better returns. What does a high performing sales organization look like? What metrics should organizations assess and track to manage growth? There are lots of opinions and often too few facts. The Alexander Group (AGI) recommends a fact-based, quantitative approach to assessing sales performance as follows: Examining these seven core performance zones provides PE leaders the insights needed to make informed decisions around the often “touchy” subject of sales. Each zone has a few key metrics. For example, Productivity focuses on bookings per rep; revenue per rep; and pipeline size, velocity and win rate. Not all metrics are equal, however. Some are critical during due diligence, while others pertain primarily to post-acquisition. Here is a brief description of the metrics that matter:
Pre-Acquisition Metrics
Deal leaders must make the best possible decisions with limited information during a quick diligence cycle. Some cycles last only a few weeks, and the acquisition target rarely provides all the data desired. Making the right go/no-go decision with imperfect information separates successful PE firms from the pack. Here are the foundational sales metrics for due diligence:
- CPR (Conversion, Penetration and Retention): Analyze revenue mix at the account level and partition between new business (conversion), cross-sell/upsell (penetration) and renewal business (retention). Overreliance on retention suggests the company has become complacent; marketing and sales may be struggling to drive incremental growth. Ideally 50+ percent of revenue comes from conversion and penetration, although this figure should be as high as 80 percent for less mature businesses. Revenue churn is also a critical by-product of this analysis. Churn rates above 10 percent per year generally indicate room to improve.
- E/R (Expense to Revenue): The simplest way to measure a sales organization’s profitability, or ROI. Many PE leaders struggle to measure E/R correctly because some costs are difficult to attribute to the sales organization. Include four sales investment categories in the calculation: 1) Management Compensation, 2) Rep Compensation, 3) Sales Enablement (e.g., field marketing & overlays) and 4) Infrastructure (e.g., travel & entertainment). E/R is highly correlated to industry and growth stage. For example, cross-industry E/R = 14 percent¹ but pure-play cloud E/R = 46 percent.² Also consider E/B (Expense to Bookings) as it is usually a better metric to measure sales force profitability.
- Bookings per Rep: What do sales representatives produce each year? More importantly, how is this trending over the last 3 years? Trending analysis helps PE leaders understand the direction the sales organization is heading. It also serves as an indicator of other potential issues such as deficient recruiting practices, coaching and development practices, and ramp times. These are common areas requiring post-acquisition repair.
- Percent of Reps at Quota: The ideal range is 55-60 percent of reps at or above quota. However, cross-industry benchmarks indicate closer to 40 percent of sales representatives typically reach quota. Too many reps hitting quota suggests a “nice place to work” environment where quotas are set too low. But too few reps hitting quota leads to low morale and high turnover. This figure correlates surprisingly well with the magnitude of personnel changes typically required to turn around the sales organization.
Alexander Group also recommends detailed pipeline analysis to determine growth potential going forward. Securing accurate pipeline data during the diligence phase may be difficult due to poor pipeline management and governance practices at the target company—which should serve as a big warning signal!
Post-Acquisition Metrics
Investment and operating partners regularly spearhead sales leadership and sale model changes to reinvigorate portfolio company growth. What metrics can guide those changes? How should investment and operating partners evaluate ongoing performance? The aforementioned metrics are crucial for ongoing evaluation. Yet it takes more inspection to understand the true extent of issues and opportunities. The following metrics help:
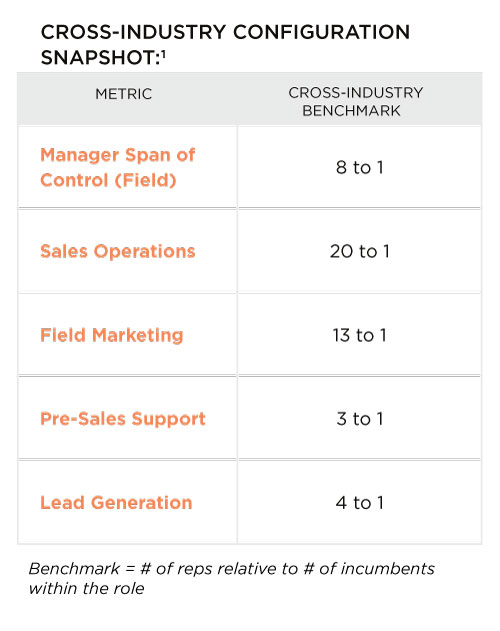
- Configuration: Sales model transformation often entails reallocating headcount to ensure the right blend of field vs. inside and organic vs. overlay resources. Many companies place undue emphasis on organic quota-carrying representatives. Yet often wise investments in enablement resources such as lead generation, pre-sales or specialist roles drive greater rep productivity. The table below shows typical deployment ratios:

- Ramp Time & Sales Enablement: Ramp time ranges from three months for transactional sales models to nine or even 12 months for complex selling organizations. Thoughtful enablement investments can shorten ramp time and thus increase rep productivity. Organizations with deficient enablement investment (e.g., onboarding, sales playbooks) lag their peers. This is a common problem for companies that treat sales as an afterthought. As a general rule, sales leaders should allocate at least 35 percent of the sales budget towards enablement levers.
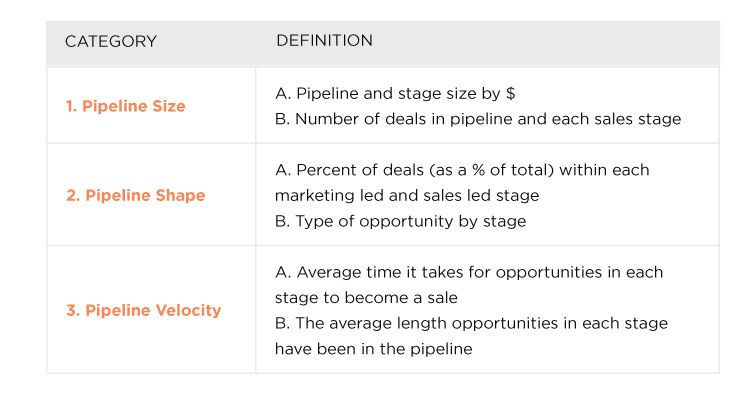
- Pipeline: Capturing and analyzing detailed pipeline data is the gold standard for pre-acquisition efforts. However, no two pipelines are designed the same (e.g., SQL definition varies from one company to another); sales management regularly fails to install governance mechanisms to drive accurate pipeline reporting. Don’t put faith in pipeline statistics until you have firm control over the data, which may take time to establish post-acquisition. Once in place, operating partners should conduct regular reviews of three pipeline metrics:
 Revenue growth requires the right leadership executing the right strategy with the right sales structure and sales personnel. Metrics are an integral piece to this formula. Investment and operating partners should define metrics that matter across the portfolio company life cycle. Then continually measure those metrics to gauge and manage performance. Leverage benchmarks where possible. Drive higher portfolio returns as a result.
How does your portfolio company’s sales force stack up? Contact the Alexander Group to learn about our industry and sales model-specific benchmarking for the metrics described in this post.
_____________________
Data Sources:
1. Alexander Group Analytics Database
2. Alexander Group 2015 Cloud Sales Index
Learn more about Alexander Group’s Private Equity practice.
Contact an AGI Private Equity practice leader.